
- November 5, 2023
- Posted by: SouTech Team
- Category: Blog
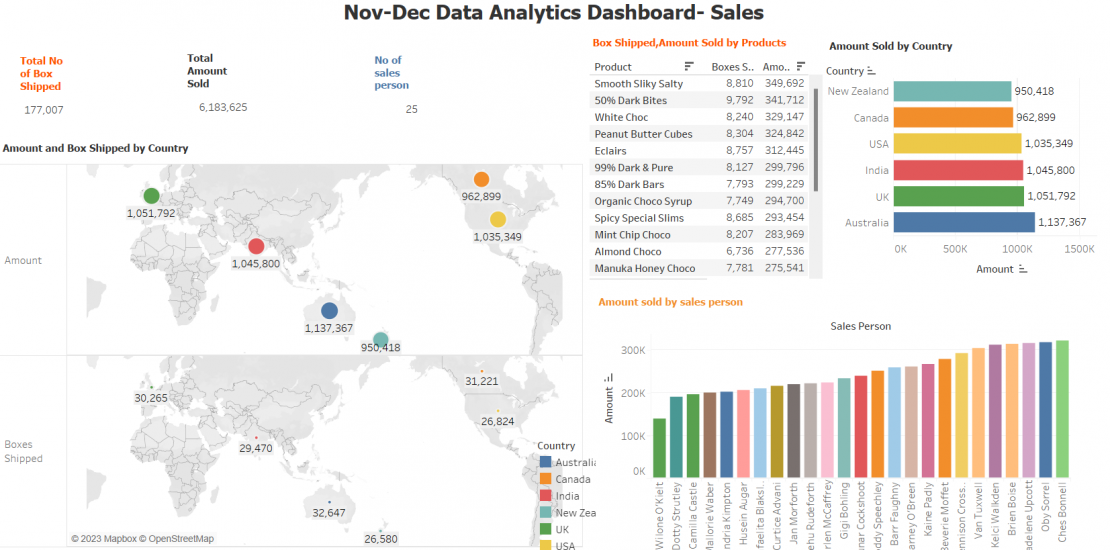
https://public.tableau.com/app/profile/victor.chidi5881/viz/SampleData-SalesDashboard/FinalDashboard
this is the direct link to my visualization of the last project
Welcome to Tableau Public
A free platform to explore, create, and publicly share data visualizations online.
Creating a visualization dashboard in Tableau is a multi-step process. Here’s a detailed guide to help you get started:
Step 1: Install and Set Up Tableau:
Download and install Tableau Desktop from the Tableau website.
Launch Tableau Desktop and choose the appropriate version based on your operating system (Windows or Mac).
Open a new workbook.
Step 2: Connect to Data:
In Tableau, data sources can be Excel spreadsheets, databases, web data connectors, or cloud data sources. Click on “Connect to Data” to choose your data source.
Follow the prompts to connect to your data source and import your dataset.
Step 3: Prepare Data:
Clean and structure your data as needed. This includes removing duplicates, handling missing values, and renaming fields.
Create calculated fields or aggregates if required for your analysis.
( will have this in coming videos- do well to subscribe to stay updated)
Step 4: Build Visualizations:
Drag and drop dimensions and measures onto the Columns and Rows shelves to create basic visualizations like bar charts, line charts, scatter plots, etc.
Customize your visualizations using the Marks card. Adjust colors, labels, tooltips, and formatting as needed.
Use the Show Me feature to explore different visualization options and choose the most appropriate chart type for your data.
Step 5: Create Dashboards:
Click on the “Dashboard” tab to create a new dashboard.
Drag sheets from your workbook onto the dashboard canvas to create dashboard elements.
Adjust the size and position of each element to create a visually appealing layout.
Step 6: Add Interactivity:
Create interactivity by adding actions like filter actions, highlight actions, URL actions, and parameter actions.
You can make elements on the dashboard act as filters for other elements to enable dynamic exploration of data.
Step 7: Add Text and Images:
Enhance your dashboard by adding text, images, and shapes. You can add titles, descriptions, and explanatory notes to make your dashboard informative.
Step 8: Format and Design:
Format your dashboard to make it visually appealing. You can change fonts, colors, and backgrounds.
Ensure that the layout is well-organized and easy to navigate.
In subsequent videos will be taking you on a guide – how to save, share and publish your work
Step 9: Publish and Share:
Save your workbook.
Publish your dashboard to Tableau Server or Tableau Public for sharing with others.
Create a URL or embed code to share your dashboard on websites or within your organization.
Step 10: Maintain and Update:
Regularly update your dashboard with new data or refresh the existing data source.
Monitor the performance of your dashboard to ensure it loads quickly and functions smoothly.
Related posts:
 PowerBI PL300 Certification: Your Guide to Advanced Data Visualization
 Step by step guide on how to implement Kali Linux as host OS on a PC: Tutorial
 How to become an expert in R for data science and machine learning – step by step guide
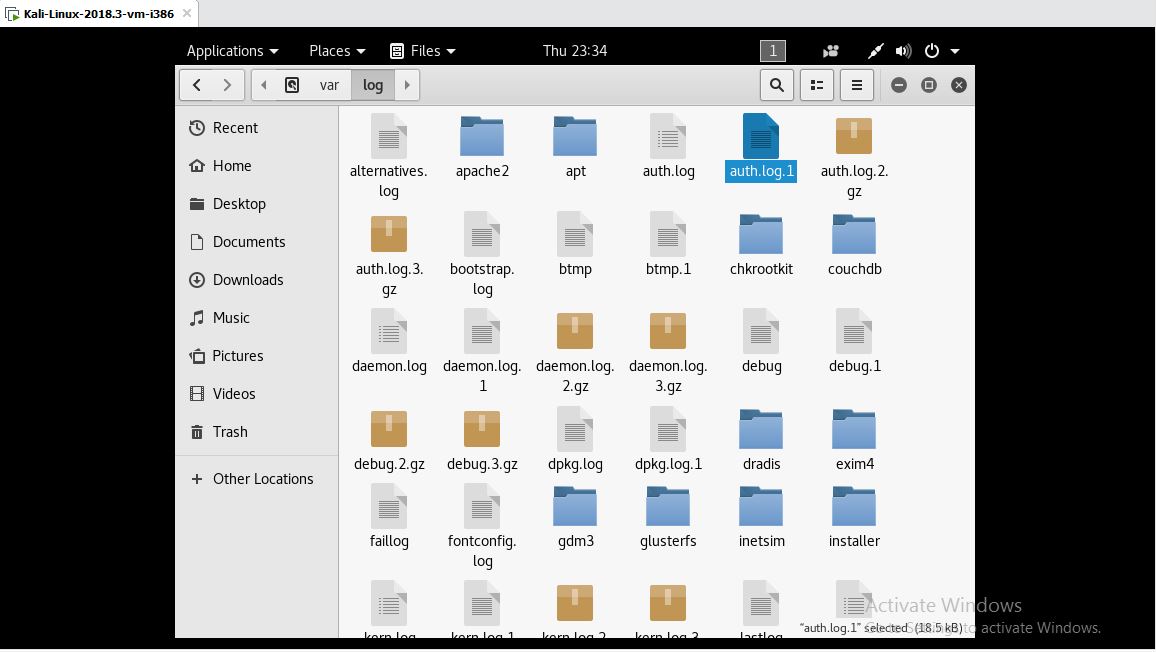 How to install Kali Linux in Oracle VirtualBox on a Windows computer: Step by Step Guide