
- August 14, 2020
- Posted by: Data Science Training and Solution
- Category: Data Analysis and Virtualization, Data Science Free Training
No Comments

Numpy and Pandas
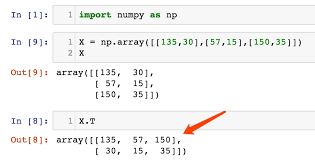
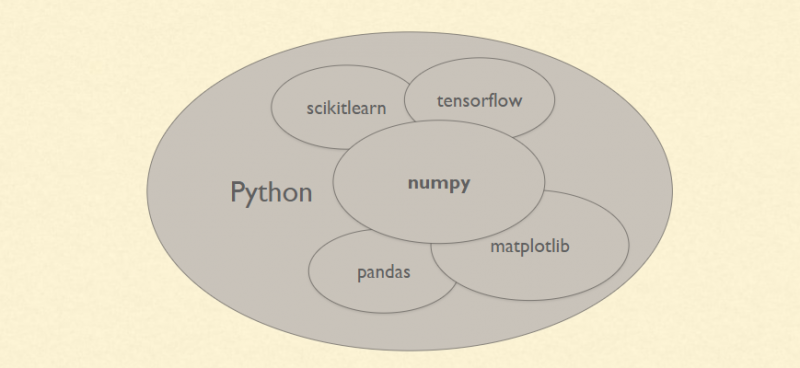
Numpy is a python package that is used for scientific computing. It provides support for large multi-dimensional arrays and matrices. Pandas is a python library used for data manipulation and analysis. Having a solid knowledge of both libraries is extremely useful for feature engineering, data imputation, and model building
>>> import numpy as np
Some of the important attributes of a NumPy object are:
- Ndim: displays the dimension of the array
- Shape: returns a tuple of integers indicating the size of the array
- Size: returns the total number of elements in the NumPy array
- Dtype: returns the type of elements in the array, i.e., int64, character
- Itemsize: returns the size in bytes of each item
- Reshape: Reshapes the NumPy array
 # list
bob =[1,2,3]
print(bob)
import numpy as np


# In[3]:


# 1-Dimensional array
tuna =[1,3,4,5,6,7,8]
np.array(tuna)

# In[4]:
# 2-Dimensional array
mat = ([1,2,3],[4,5,6],[5,6,7])
np.array(mat)


# In[5]:
#note that when dealing with 2-D
# it always end with 2 ']]' of that
# and if it is three of it ']]]' then it is 3-D


# In[6]:
np.arange(0,11)


# In[7]:


# when dealing with range in array we use arange
np.arange(0,11,2) # the last parameter is the step(even num)


# In[11]:


# means 9 dot(.)
np.zeros(9)+2


# In[10]:


np.zeros((2,4)) # 2 -> num of rows
                # 4 -> num of columns


# In[11]:


np.ones((2,5))


# In[ ]:


# In[12]:


# linspace will take the number of POINT(dot. ) that we want e.g below is 5
np.linspace(0,5,5)


# In[13]:


#creating identity matrix
# it a 2-D -> number of rows = number of colums
np.eye(5, dtype=int)


# In[14]:


#the random library can also be used by
from numpy.random import randint
randint(2,7) #it give a random num from btw 2->6


# In[15]:


# arrays of numbers = 1-D
np.random.rand(5)


# In[16]:


np.random.rand(5,5) # 2-D


# In[17]:


np.random.randn(4,2) #return num < 0


# In[18]:


# it give a random num btw the number but exclusive 100
np.random.randint(0,100)


# In[19]:


np.random.randint(56,100,10)
#10 means 10 random numbers will be displayed butexclusive 100


# In[20]:


#attribute of an array
arr = np.arange(25)
arr


# In[21]:


# reshape is used to return the data of an array
# e.g arr above is 25 element and can be RESHAPED as 5x5 = 25
arr.reshape(5,5)


# In[22]:


rar = np.random.randint(0,51,10)
rar


# In[23]:


rar.reshape(2,5)


# In[93]:


#to return the maximum and minimum of an array
rar


# In[94]:


rar.max()


# In[95]:


rar.min()


# In[96]:


#getting the index location of the max value
rar.argmax()


# In[98]:


#getting the index location of the min value
rar.argmin()


# In[99]:


#getting the shape of a vector = size of array (1-D)
rar.shape


# In[29]:


rar  = rar.reshape(2,5)
rar.shape


# In[106]:


#getting datatype
arr.dtype


# In[107]:


rar.dtype


# In[11]:


np.full((5,4),3.14)


# In[24]:


mat = np.arange(1,26).reshape(5,5)
mat


# In[25]:


# NB all counting start from 0 for both rows and cloumn
mat[2:] # count row 2 down


# In[26]:

mat[2:,1:] # 1: reps column

# In[28]:

mat[3:,3:]
>>> import pandas as pd
Some commonly used data structures in pandas are:
- Series objects: 1D array, similar to a column in a spreadsheet
- DataFrame objects: 2D table, similar to a spreadsheet
- Panel objects: Dictionary of DataFrames, similar to sheet in MS Excel
# In[1]:
import pandas as pd
# In[2]:
import numpy as np
# In[20]:
labs = ['a','b','c']
my_data = [11,30,40]
arr = np.array(my_data)
d = { 'a': 20, 'b':30,'c':40}
# In[21]:
pd.Series(data = my_data)
# In[22]:
pd.Series(data = my_data, index=labs)
# In[23]:
#OR
pd.Series(my_data,labs)
# In[24]:
pd.Series(arr,d)
# In[25]:
pd.Series(d)
# In[14]:
# a pandas series can hold a varities of numbers or object types
# In[21]:
ser1 = pd.Series([1,2,3,4],['USA','Germany','USSR','Japan'])
ser1
# In[22]:
ser2 = pd.Series([1,2,6,4],['USA','Germany','Italy','Japan'])
# In[24]:
#passing the index of 1
ser1['USA']
# In[27]:
ser3 = pd.Series(labs, my_data)
ser3
# In[26]:
ser3[0] #index labs
# In[28]:
ser1
# In[29]:
ser2
# In[30]:
ser1 + ser2  #integer is converted to float
# In[ ]:
Related posts:
 Pandas Tutorial- How to run analysis using Pandas Python
 Python for Data Analysis Training in Abuja Lagos PH Nigeria 2023
 Python Data Science Tools: How to Install Jupyter NoteBook Tutorial
 Data Science Tutorial Guide: Nigerian Population Data analysis Case Study
 R and R Studio Installation and Set up for Data Analysis Nigeria