
- May 4, 2021
- Posted by: SouTech Team
- Category: Others
The exponential growth of data has created a new area of interest in technology and business called “Big Data”. In general, a data set or a business problem belongs to the Big Data classification when its data is so vast, fast or complex that it becomes impossible to store, process, and analyze using traditional data storage and analytics applications.
How much data does it take to become Big Data? Are 100 terabytes enough? Are 1000 petabytes enough? The baby in the figure already has gigabytes of online data associated with her name. Is that Big Data? Volume is only one of the criteria because the need of real time processing of the data (also called data in motion) or the need of integrating structured and unstructured data, may qualify the problem as Big Data problem.
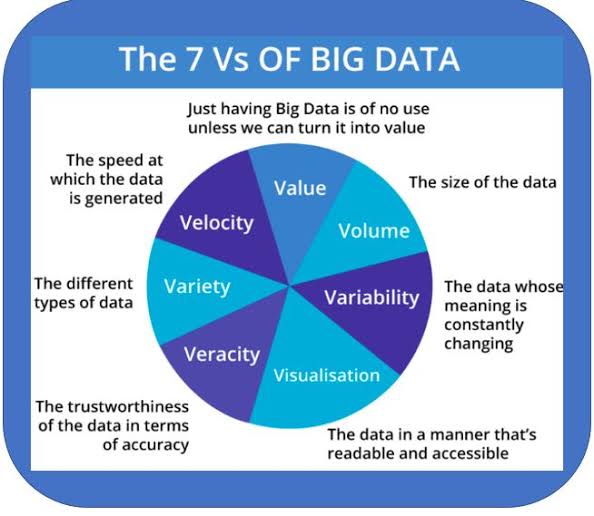
How do you define big data? The seven V’s sum it up pretty well –
Volume, Velocity, Variety, Variability, Veracity, Visualization, and Value.
The “Big” in Big Data distinguishes data sets of such grand scale that traditional database systems are not up to the task of adequately processing the information. However, there is more to what makes Big Data big than simply its scale. Doug Laney, an analyst for Gartner, once described Big Data as consisting of the three dimensions of high volume, high velocity and high variety, but there are other “Vs” that help comprehend the Big Data’s true nature and its implications.
You can take your big data knowledge to the next level by enrolling for CISCO Big Data & Analytics
See details:
Big Data = Game-changing Insights
Architectures and processes of the past are making way for more modern, real-time applications thanks to IoT (Internet of Things) systems and the data they collect. Dynamic data platforms are being built, and our ability to extract data using the latest analytics techniques is growing. So why not gain an edge and increase your employability by learning new skills? Skills such as collecting, storing, and visualizing data obtained from IoT sensors are in high demand. Be one of the few who know how to use data analytics to gain amazing insights from the intelligence produced. Insights that can help businesses make more-informed decisions.
You’ll Learn These Core Skills:
-
Use Python to create code that reads data from sensors and stores it in a SQL database.
-
Visualize, clean, manipulate and integrate data sets.
-
Learn fundamental principles of Big Data platforms like Hadoop.
-
Use storytelling to present insights gained from extracted data.
7 V’s of Big Data: IoT(Internet of Things) and Big Data
Volume
When discussing Big Data volumes, almost unimaginable sizes and unfamiliar numerical terms are required:
- Each day, the world produces 2.5 quintillion bytes of data. That is 2.3 trillion gigabytes.
- By 2020, we will have created 40 zettabytes of data, which is 43 trillion gigabytes.
- Most companies already have, on average, 100 terabytes of data stored each.
- Facebook users upload that many data daily.
- Walmart alone processes over a million transactions per hour.
Velocity
Underlying the volume numbers is an even larger trend, which is that 90 percent of extant data have been created in just the last two years. The speed at which data are generated, accumulated and analyzed is on a steep acceleration curve. As of next year, there will be 19 billion network connections globally feeding this velocity.
Although most data are warehoused before analysis, there is an increasing need for real-time processing of these enormous volumes, such as the 200 million emails, 300,000 tweets and 100 hours of Youtube videos that are passing by every minute of the day. Real-time processing reduces storage requirements while providing more responsive, accurate and profitable responses.
Variety
Another challenge of Big Data processing goes beyond the massive volumes and increasing velocities of data but also in manipulating the enormous variety of these data. Taken as a whole, these data appear as an indecipherable mass without structure. Consisting of natural language, hashtags, geo-spatial data, multimedia, sensor events and so much more, the extraction of meaning from such diversity requires ever-increasing algorithmic and computational power.
Variability
Furthermore, the intrinsic meanings and interpretations of these conglomerations of raw data depends on its context. This is especially true with natural language processing. A single word may have multiple meanings. New meanings are created and old meanings discarded over time. Interpreting connotations is, for instance, essential to gauging and responding to social media buzz. The boundless variability of Big Data therefore presents a unique decoding challenge if one is to take advantage of its full value.
Veracity
Understanding what Big Data is telling you is one thing. However, it is useless if the data being analyzed are inaccurate or incomplete. This situation arises when data streams originate from diverse sources presenting a variety of formats with varying signal-to-noise ratios. By the time these data arrive at a Big Data analysis stage, they may be rife with accumulated errors that are difficult to sort out. It almost goes without saying that the veracity of the final analysis is degraded without first cleaning up the data it works with.
Visualization
A core task for any Big Data processing system is to transform the immense scale of it into something easily comprehended and actionable. For human consumption, one of the best methods for this is converting it into graphical formats. Spreadsheets and even three-dimensional visualizations are often not up to the task, however, due to the attributes of velocity and variety. There may be a multitude of spatial and temporal parameters and relationships between them to condense into visual forms. Solving these problems is the main impetus behind AT&T’s Nanocubes visual representation package.
Value
No one doubts that Big Data offers an enormous source of value to those who can deal with its scale and unlock the knowledge within. Not only does Big Data offer new, more effective methods of selling but also vital clues to new products to meet previously undetected market demands. Many industries utilize Big Data in the quest for cost reductions for their organizations and their customers. Those who offer the tools and machines to handle Big Data, its analysis and visualization also benefit hugely, albeit indirectly.
Although Volume, Velocity and Variety are intrinsic to Big Data itself, the other Vs of Variability, Veracity, Value and Visualzation are important attributes that reflect the gigantic complexity that Big Data presents to those who would process, analyze and benefit from it. All of them demand careful consideration, especially for enterprises not already on the Big Data bandwagon. These businesses may find that their current best practices related to data handling will require thorough revamping in order to stay ahead of the seven Vs.
Start your Big Data Career TODAY!
Start HERE: https://forms.gle/ygyqm64UzN5VLtoH6
Contact your course adviser on WhatsApp: 08034121380
Related posts:
 Python for Data Analysis Training in Abuja Lagos PH Nigeria 2023
Why You Need to Learn IBM SPSS Data Analysis Software Now
Data Science Process: Collecting, Cleaning, Analyzing, Modeling and Visualizing Data
Download all Netflix movies in a second: new record for data transfer rate over fiber optic was 178 Tbps
Python for Data Analysis Training in Abuja Lagos PH Nigeria 2023
Why You Need to Learn IBM SPSS Data Analysis Software Now
Data Science Process: Collecting, Cleaning, Analyzing, Modeling and Visualizing Data
Download all Netflix movies in a second: new record for data transfer rate over fiber optic was 178 Tbps
 Ethical Hacking , Data Science, Digital Growth Hack Workshop in Owerri- SOUTECH Hub